Gantt Chart Overview
The Gantt Chart is the core view in GlidePath. It provides a timeline visualization of your entire project with tasks, dependencies, critical path highlighting, and real-time CPM calculations.Feature Spec Reference
Module 6 — Gantt ViewWhat Is a Gantt Chart?
A Gantt chart displays project tasks as horizontal bars on a timeline. The position and length of each bar represent:- Left edge = Task start date
- Right edge = Task finish date
- Bar length = Task duration
Gantt Chart Components
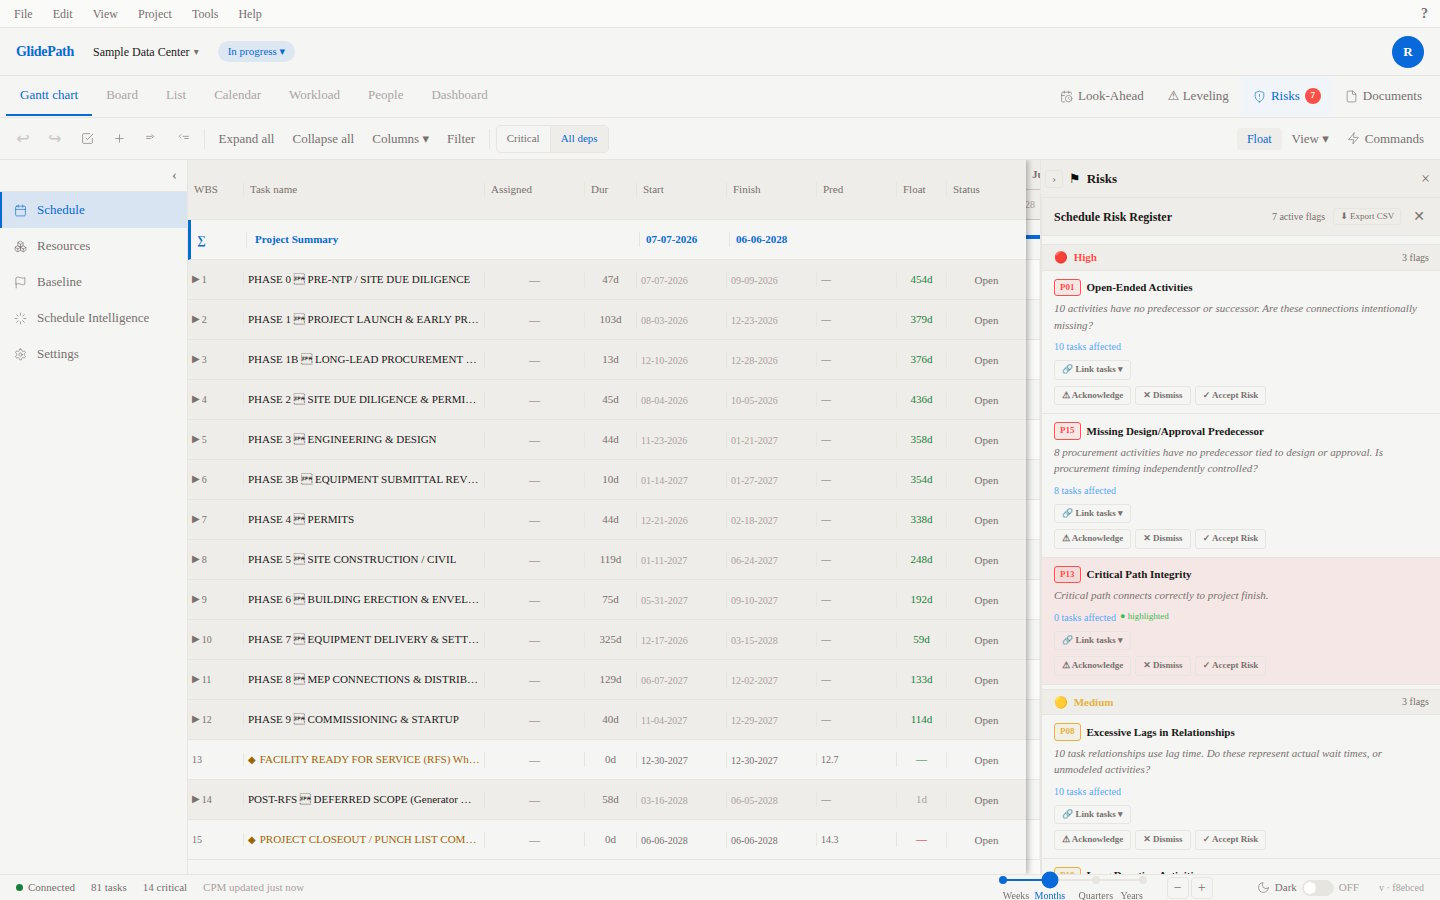
Left Panel: Task List
- WBS Number: Hierarchical task numbering (1, 1.1, 1.1.1, etc.)
- Task Name: Description of the work
- Duration: How long the task takes (in days)
- Start Date: When the task begins
- Finish Date: When the task completes
- Progress %: Percentage complete (0–100%)
- Constraint Type: ASAP, ALAP, MSO, MSF, SNLT, SNLT, FNLT, FNLT (Module 2.7)
- Additional Columns: Resource, Cost, Notes (customizable via Module 6.4)
Right Panel: Timeline
- Horizontal Bars: Each bar represents one task. Bar color indicates:
- Red/Bold: Task is on the critical path (zero float)
- Blue/Standard: Task has float (schedule slack available)
- Diamond shape: Milestone (zero duration task)
- Parent bar: Summary task showing rollup of child dates
- Dependency Lines: Connecting lines between tasks showing relationships (FS, SS, FF, SF)
- Solid line: Relationship with no lag
- Dashed line: Relationship with lag
- Today Line: Vertical line marking today’s date for quick date orientation
- Gridlines: Minor (day) and major (week/month) gridlines depending on zoom level
Timescale
Above the timeline, the timescale shows the date range. Selectable zoom levels:- Day: Shows each day; best for detailed scheduling near-term work
- Week: Shows each week; standard view for most projects
- Month: Shows each month; best for high-level overview
Toolbar
Above the Gantt chart:- + Add Task: Create a new task
- Zoom Controls: Zoom in, zoom out, fit to window
- Search/Filter: Find and filter tasks by name, status, resource
Reading the Gantt Chart
Task Status at a Glance
- Red bars = Critical path tasks (any delay delays the project)
- Blue bars = Non-critical (have available float)
- Progress fill = How much of the bar is shaded (progress %)
- Diamond shape = Milestone task (zero duration)
Dependency Flow
- Solid lines = Hard dependencies (immediate relationship)
- Dashed lines = Dependencies with lag (waiting period)
- Hover over a dependency line to highlight the connected tasks
Critical Path
The longest sequence of dependent tasks is highlighted in red. GlidePath uses backward pass (Module 3.2) to identify the critical path—any delay to critical path tasks delays your entire project finish date.Interacting with the Gantt Chart
Click Actions
- Click a task bar: Select the task; details appear in the Task Detail Panel (right side)
- Click a dependency line: Edit or delete the dependency
- Click a column header: Sort by that column
Drag Actions
- Drag a task bar left/right: Move task to a new start date (if not constrained)
- Drag the right edge of a bar: Extend or shorten the task duration (if not constrained)
Double-Click
- Double-click a task row: Open the full Task Detail Panel for editing
Scroll
- Horizontal scroll: Navigate left/right through the timeline
- Vertical scroll: Navigate up/down through the task list
Common Gantt Chart Views
Next Steps
- Creating Tasks — Add your first tasks
- Understanding Dependencies — Link tasks together
- Critical Path — Understand schedule-critical work
Tip: Use zoom controls to switch between high-level overview (Month) and detailed scheduling (Day). The timeline updates instantly, and your work is never lost.